Knowing how to convey information in the most efficient and accessible way possible is crucial for creating top-notch technical documentation.
However, although writing technical documentation is the main skill needed for that challenging feat, there’s another important element besides text—visuals.
Visuals can raise technical documentation to another level. The crucial part is knowing how, when, and why to use them.
If you don’t know the answers to those questions, don’t worry, we’ll provide them in this article.
Let’s get started!
Why Are Visuals Important in Technical Documentation
Technical documentation has a challenging task. It should present complex concepts in an accessible way, teach readers how to perform a particular task, and provide understandable information about a product.
That is especially true when it comes to software products. Software documentation can be aimed at everyday users but also at experts like software developers.
Being able to present information in a clear and comprehensible way to every target audience is the writers’ Holy Grail. And using visuals is an essential practice to help them get to it.
As Will Fleming, author of Technical Writing at LBCC, states, visuals are sometimes simply superior to text when it comes to making information accessible.
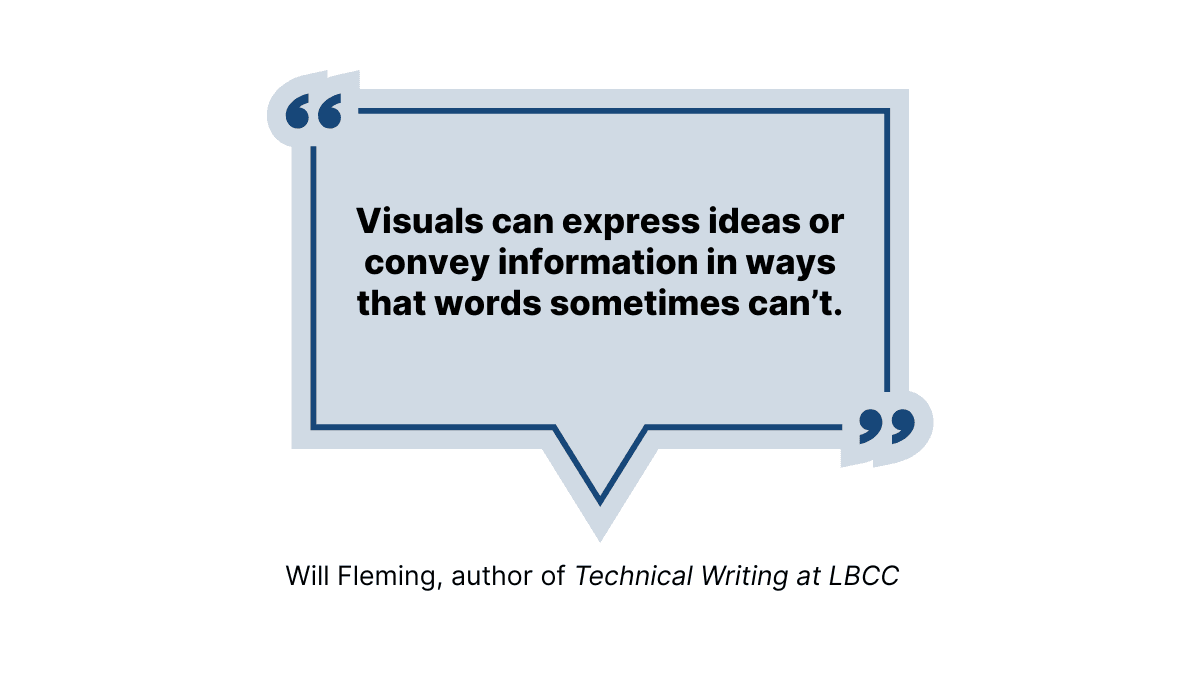
Illustration: Archbee.com / Data: OpenOregon Educational Resources
For instance, when creating documentation for software, you can use visuals to present information in a way that isn’t possible when using only text.
The popular messaging tool Slack takes advantage of that fact in its documentation.
For example, their developer documentation uses screenshots to present the variations of messages that can appear. You may think otherwise but screenshots in technical documentation helps the developer team alot.

Source: Slack
How would Slack’s team show the different versions of messages without the use of visuals?
It’s hard to imagine; they would have to use very vivid writing to describe to readers what messages can look like.
Also, Slack doesn’t use visuals just to make information more understandable. They also serve to break up large sections of text.
Take a look at the example from their user guide about notifications.

Source: Slack
As you can see, they use a simplified screenshot and a bulleted list as visuals in this case.
That way, they give readers a chance to take a rest from reading while at the same time improving comprehension.
It’s a great combination for ensuring that readers successfully grasp the information.
In addition to improving comprehension and making the text more readable, visuals can also aid in retaining information.
According to John Medina, author of Brain Rules, after three days, humans remember 65% of the information they’ve heard if it’s accompanied by an image, as opposed to remembering only 10% without an image.
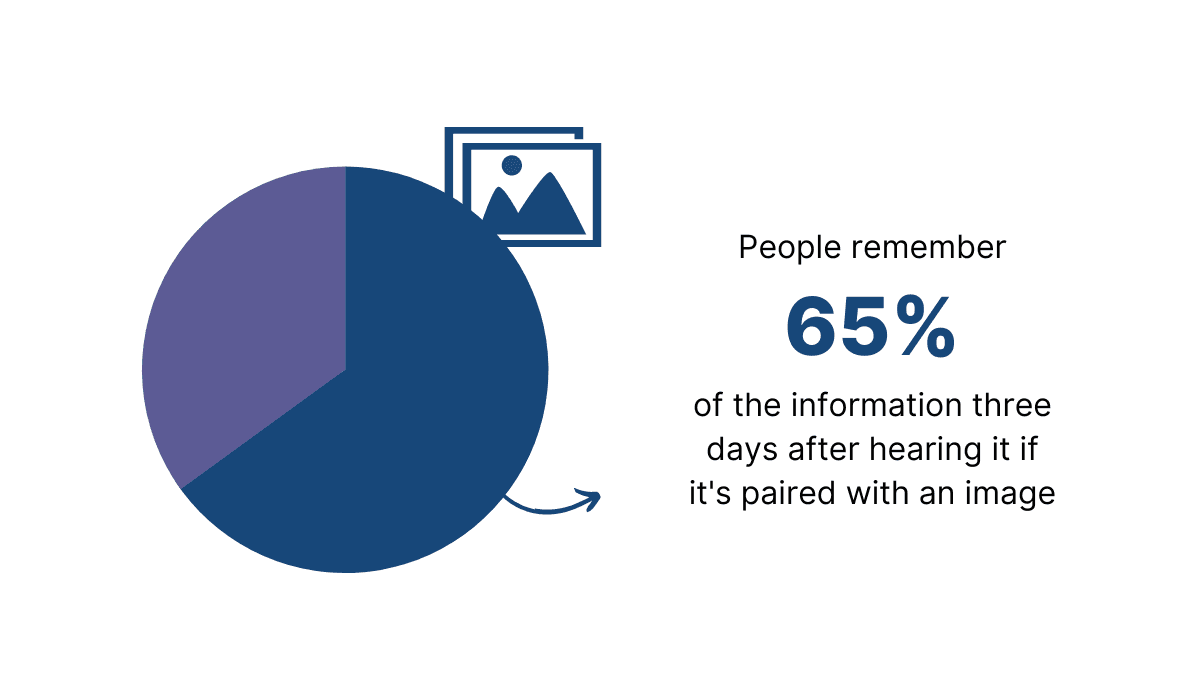
Illustration: Archbee.com / Data: Brain Rules
Therefore, you can make the information more memorable by combining it with visuals.
To sum up, technical documentation can benefit significantly from using visuals.
Improving comprehension, readability, and the retention of information is crucial for raising the quality of technical documentation—and that is the goal of anyone creating it.
When to Use Visuals in Technical Documentation
As we’ve mentioned earlier, visuals can be an excellent way of making information more accessible, comprehensible, and memorable.
As Kesi Parker, a technical writer, explains, visuals are used when words by themselves are not enough.

Illustration: Archbee.com / Data: Medium
In other words, the visuals add to the text and make the information more helpful.
For example, you should use them to convey step-by-step instructions efficiently.
That way, in addition to describing the steps a reader needs to take to complete a specific task, you can also illustrate those steps to maximize their chance of success.
Below, you can see how GitHub uses that method in its instructions for creating a repository.

Source: GitHub
To provide straightforward instructions, they use a numbered list of steps a user should take.
In addition to written instructions, there are two screenshots for steps that, as writers assessed, need more clarification.
That’s the ideal marriage of text and visuals. The text does most of the work, while visuals support and assist.
The effectiveness of instructions like the one above is backed up by research.
According to TechSmith, 67% of people are more successful in completing tasks when the instructions contain visuals like screenshots or videos.

Illustration: Archbee.com / Data: TechSmith
Visuals are also excellent at explaining complex concepts.
Let’s look at the example of Zapier, a software tool for integrating apps and automating workflows.
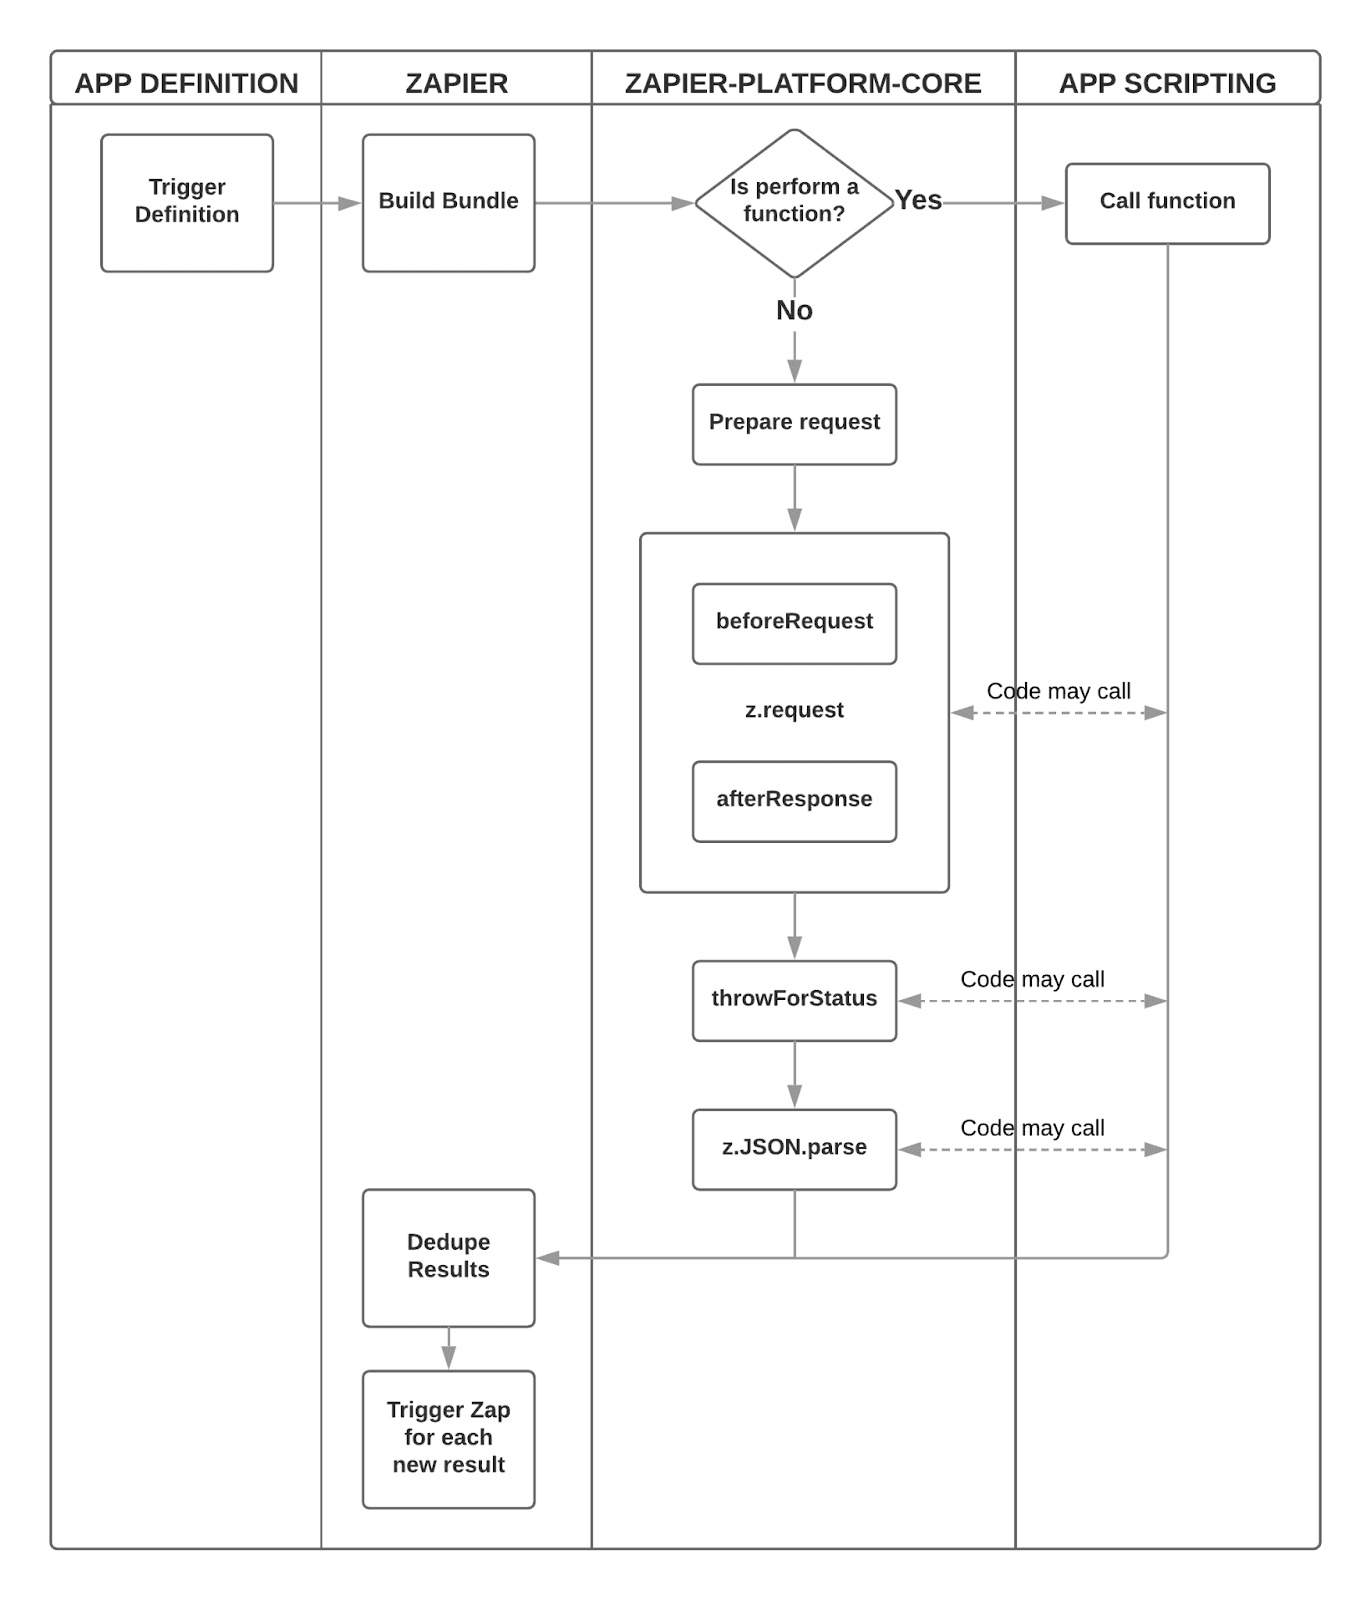
In their documentation, they describe how the product works. In very simple terms, the tool takes automated actions based on triggers.
It’s a complex process, and describing it in text is undoubtedly daunting. That’s why writers decided to illustrate that process with a flowchart.
Source: Zapier
Visuals like that can help explain complicated concepts and intricacies within software products.
There are many types of visuals to choose from for that purpose, and they all have their place in technical documentation.
Let’s examine them more closely in the next section.
Types of Visuals Used in Technical Documentation
You can include many types of visuals in your technical documentation to make it more user-friendly and helpful to your readers.
By combining them and leveraging their strengths, you can turn your documentation into a high-quality resource that conveys information with ease.
Here are some of the visuals that are great for that purpose:
- Screenshots
- Lists
- Graphs
- Charts
- Videos
- GIFs
Let’s start with the one we’ve just used above—a list.
There are different types of lists. As we’ve mentioned earlier, numbered lists are great for providing easy-to-follow instructions to the readers.
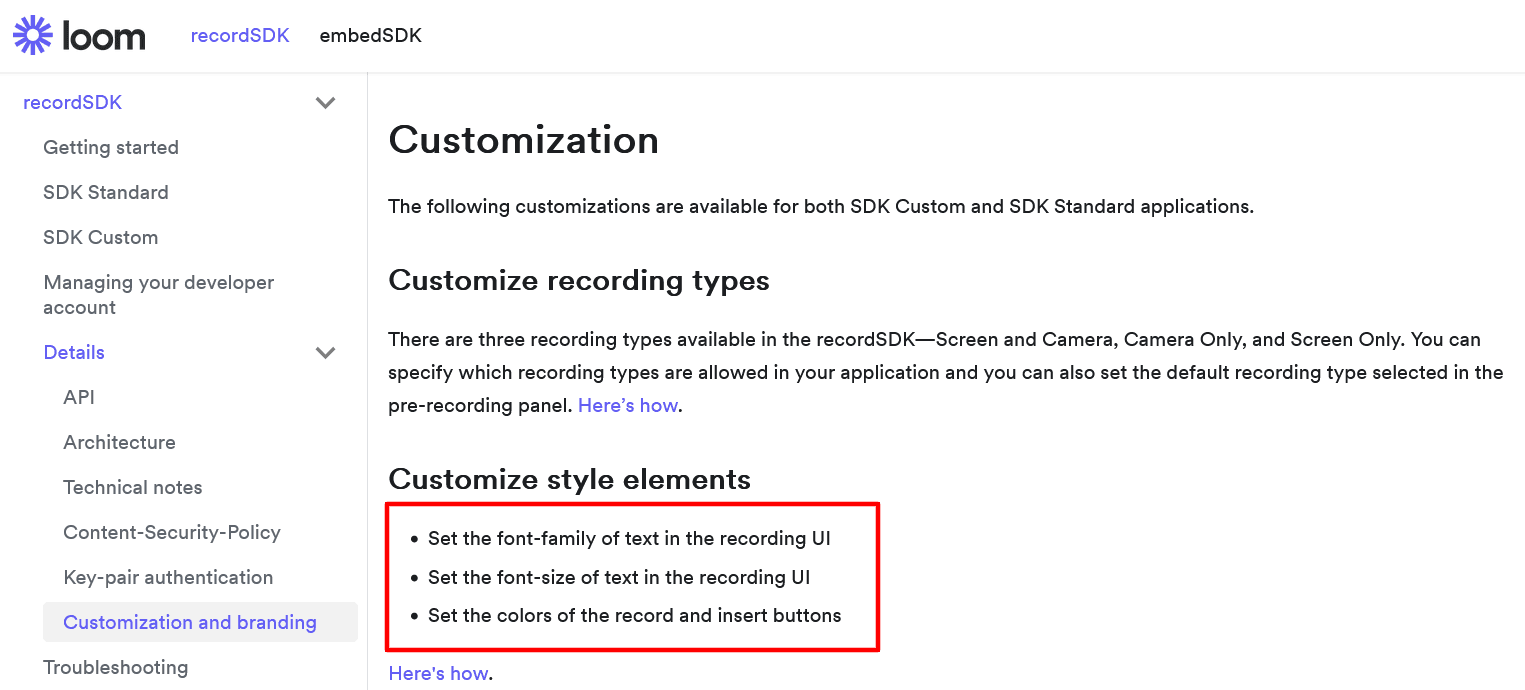
On the other hand, bulleted lists are great for isolating key points.
Source: Loom
As you can see in the example from Loom’s documentation above, emphasizing information using a list makes it instantly noticeable.
That makes lists an excellent choice when you want readers to pay attention to something in particular.
Another type of visual that’s very useful in technical writing is a screenshot.
Screenshots are a great way to complement written instructions. For example, Drift uses screenshots throughout its documentation for that purpose.

Source: Drift
They provided screenshots for the whole process of setting up Wallet, Deposits, and Withdrawals in their trading tool.
That’s an easy task if you use Archbee as your product documentation tool, as the team from Drift did.
Archbee allows you to easily implement images, GIFs, videos, charts, and other types of visuals. You can simply drag and drop a visual from your computer or paste a link to it.
And although screenshots like the one above are undoubtedly valuable for providing instructions for executing an action, videos are hard to beat in that department.
For instance, Stripe has a whole video library with instructions for developers.

Source: Stripe
Videos can supplement the written instructions, but they can also replace the text altogether.
The downside is that they require the most time and resources to make, and they are not suitable for every occasion.
For example, a user might not be able to watch and listen to a video because of their surroundings, or they simply want to quickly scroll through some written material instead of watching a ten-minute video on the subject.
That’s why there’s no one ideal type of visual for technical documentation. Combining them and using them appropriately is the best way to ensure a great user experience.
What Makes a Good Visual in Technical Documentation
A visual in technical documentation should have a clear purpose.
Whether it’s an image, video, chart, or something else, it should help a reader understand the topic at hand.
In other words, visuals are not included in the technical documentation to make it prettier. Their purpose is to teach, clarify, and explain.
Tom Johnson, a technical documentation specialist, puts it like this:
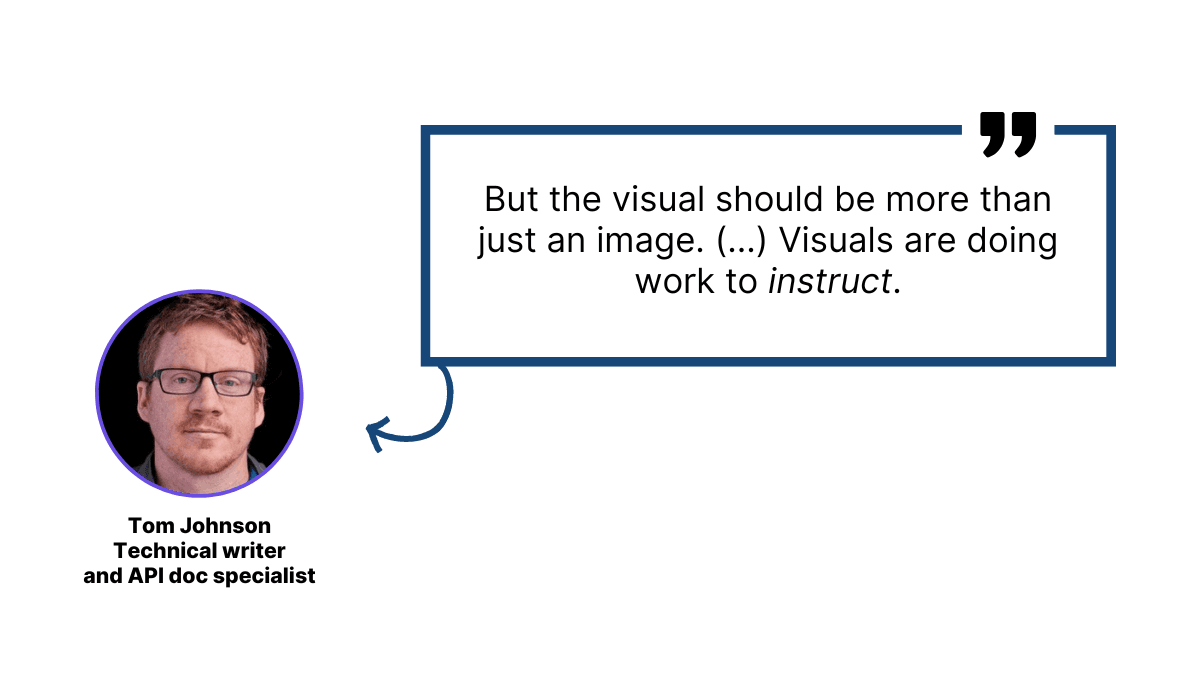
Illustration: Archbee.com / Data: I’d Rather Be Writing
Therefore, a good visual in technical documentation should attract the attention of a reader, as well as clearly convey the information.
The point of a visual should be apparent as soon as the reader looks at it. Having too many elements in one visual can confuse the reader and draw attention away from its purpose.
If that happens, its usefulness is questionable.
That’s why embracing minimalism is a great approach while creating visuals for technical documentation.
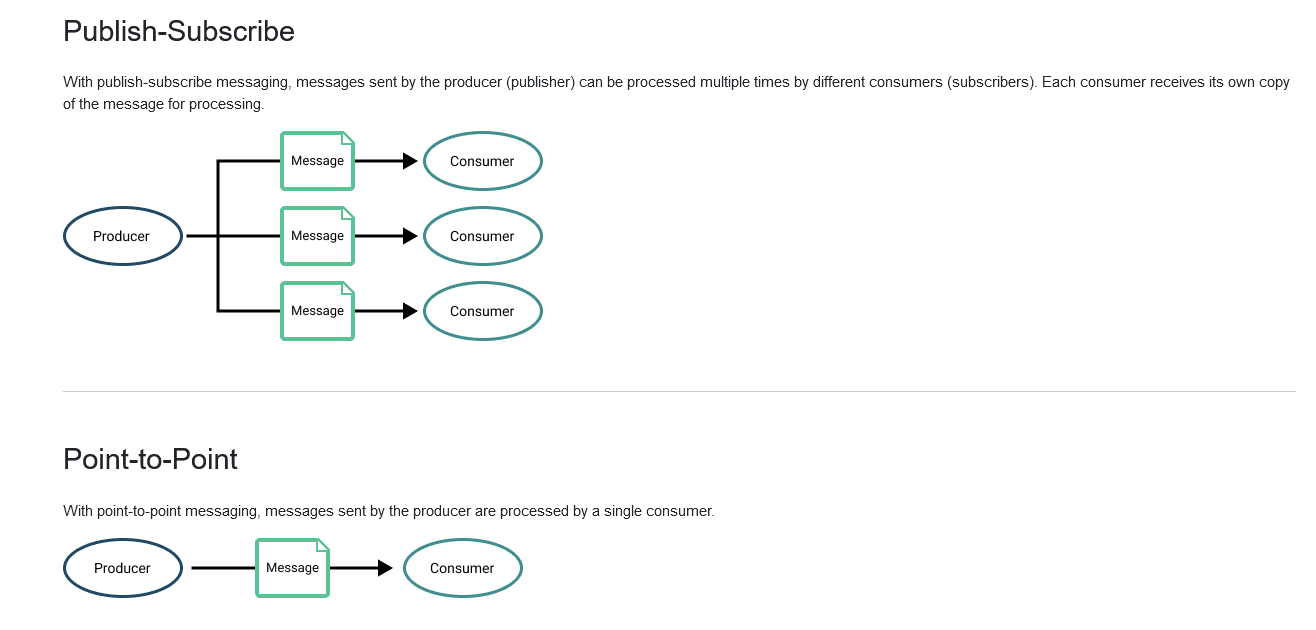
For instance, take a look at the Solace documentation below.
Source: Solace
The illustrations they use to explain message exchange patterns are very simple.
They consist only of a few shapes, lines, and arrows. The colors are also subdued.
Also, the design of illustrations is consistent throughout the documentation. Here is an example from a different page:

Source: Solace
That kind of consistency reduces visual clutter and makes it easier for readers to quickly consume information as they become familiar with the visual style.
Of course, that doesn’t mean you should have the same type of visuals in all of your technical documents. In addition to the illustrations, Solace also has videos, flowcharts, etc.
The point is that the visuals are appealing, instructive, and easy to understand.
They should assist users and contribute to a better comprehension of the documentation, not make it more complicated.
By stripping the visuals down to their essentials, you can achieve that.
How to Integrate Visuals Into Technical Documentation
When you decide to use a visual in your technical documentation, you should know how to integrate it to take advantage of its full potential.
The process of integration starts in the planning stage. Before anything is even written, a writer can outline the documentation and consider the best places to put the visuals.
That can be very helpful, particularly when the documentation is more extensive.
Furthermore, planning visuals like that can influence the writing itself.
Remember that the visuals and text should work together to provide clear information to the reader. Therefore, a visual without any context isn’t particularly useful.
For instance, take a look at the screenshot from Ahrefs’s documentation:

Source: Ahrefs
What information does it convey to the user? Apart from showing them what the report looks like, nothing of value.
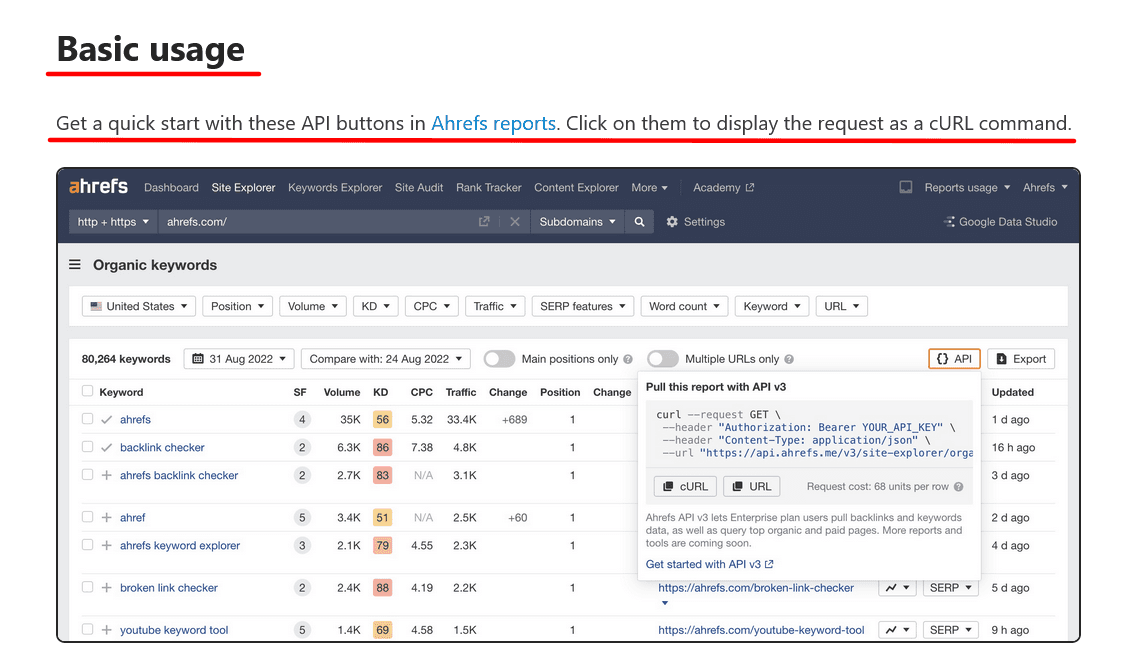
However, if you ground that visual in more context and surround it with text, it is suddenly much more helpful.
Source: Ahrefs
Now it’s clear that the screenshot shows the user where to click and what they’ll get by following that instruction.
Besides providing explanations for visuals and setting them in appropriate places in the documentation, it’s a helpful practice to surround them with white space.
Here’s how Interaction Design Foundation defines white space:
White space is the area between design elements. It is also the space within individual design elements.
The purpose of leaving white space around and within your visuals is to reduce clutter and make them more visible, more impactful.
Let’s look at another example from Ahrefs’s documentation, this time, their bulleted lists.

Source: Ahrefs
Notice how easy it is to see the lists.
That’s because there’s plenty of space around them, making them stand out, although they are not in different colors from the rest of the text and have no other visual elements.
Also, the white space between the bullets themselves makes them more readable.
To sum up, when integrating your visuals in the documentation, you should have a plan on how to do it.
Putting them into context, surrounding them with references, and giving them enough space on the page to pop out will make them the valuable tool they have the potential to be.
Conclusion
Visuals are immensely important in technical documentation.
They can help a writer in many ways.
Depending on their type, visuals can aid in clarifying instructions, providing supporting material alongside the text, attracting and keeping the reader’s attention, etc.
And, as you saw in this article, that’s just part of what the visuals can do to enrich technical documentation.
You now have enough knowledge about visuals to use them well; we hope you will put that knowledge to good use.
FAQ
Frequently Asked Questions
Visuals help readers understand faster and remember longer. They reduce cognitive load, bridge language gaps, and make dense content easier to scan.
Here’s what they do especially well:
- Speed comprehension: A screenshot or diagram shows in seconds what paragraphs might explain.
- Increase accuracy: Clear callouts and highlights reduce misclicks and wrong turns.
- Improve recall: Information paired with images is remembered far better days later.
- Boost task success: Instructions with visuals (screenshots, videos, GIFs) lead to higher completion rates.
- Support global audiences: Pictures and simple annotations help non‑native speakers follow along.
In practice:
- Screenshots show exactly where to click.
- Diagrams/flowcharts map systems, triggers, and outcomes.
- Lists isolate key points and steps for quick scanning.
Together, these raise comprehension, readability, and retention—core goals of great technical docs.
