Software is complex, and software documentation serves to reduce that complexity. These texts translate the computer’s functions into a more digestible form.
One method of simplifying this content is to employ diagrams—images that depict software architecture, logic flows, and use cases in a clear, digestible format that is understandable at a glance.
With diagrams, readers are more likely to understand a concept, as visuals significantly aid comprehension.
If you’ve never used diagrams before, and are unsure how to, don’t worry, and read on. This article will explain everything there is to know about using diagrams.
Why Are Diagrams Important in Software Documentation
Although software documentation is typically associated with text and code snippets, diagrams are also necessary to create quality documents.
Words and code, while providing detailed descriptions, nonetheless rely heavily on user comprehension.
This is where diagrams offer an advantage. As visual representations of data, diagrams use graphics to illustrate concepts and relations.
This information format is much easier for users to digest since the visual element aids understanding.
In fact, studies have proven how much easier it is to process visuals:
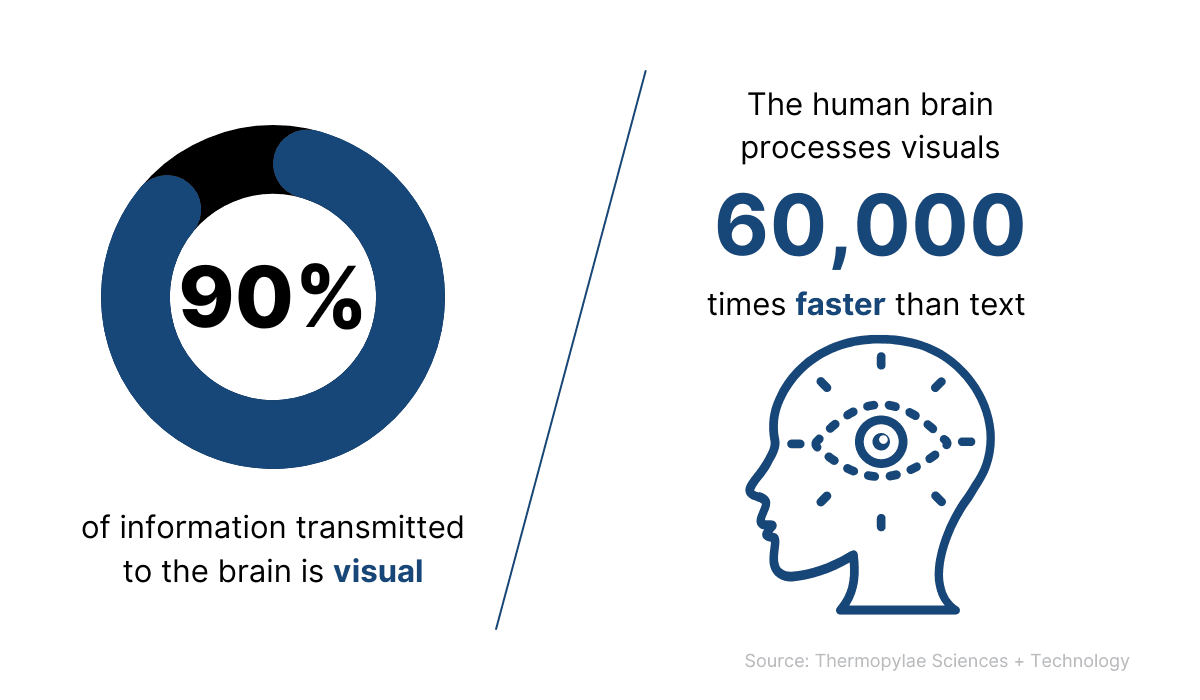
Source: Thermopylae Sciences + Technology / Image: Archbee.com
Diagrams are often ideal for conveying complex information because readers easily absorb visuals. Such charts simplify concepts and translate data into a more accessible form.
Felice Frankel has also highlighted this benefit:

Source: O’Reilly / Image: Archbee.com
Diagrams help make information more digestible. Instead of a seemingly endless wall of text, users will view bite-sized graphics, which will alleviate their anxieties as it will make them realize the data is attainable.
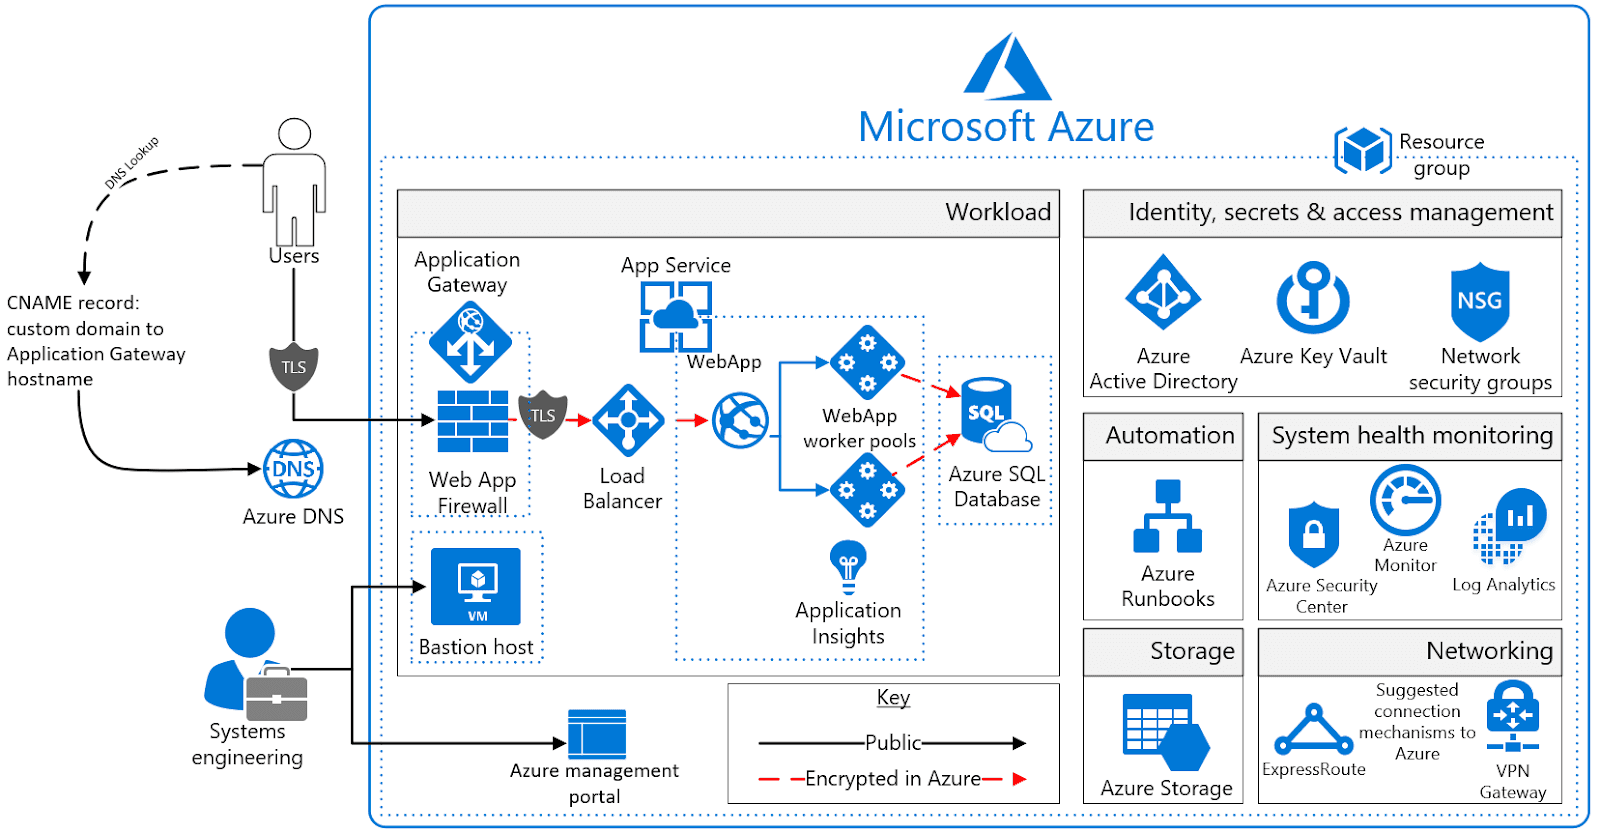
For example, look at this diagram:
Source: Microsoft
The diagram depicts the Microsoft Azure architecture, with clear indications between each component’s dependencies and workflows.
Even those unfamiliar with Azure would likely understand the data relations.
Now imagine if this same organization was only described in words. It would take up double the space and require significant effort to fully comprehend the details.
Consequently, the diagram is indubitably the better choice.
This is especially true considering the diagram’s content. Software is intricate and often convoluted (especially enterprise software).
These diagrams help simplify such mammoth programs, translating large-scale data into single-page, digestible illustrations.
Newcomers to your organization can particularly benefit from such illustrations, as they should be able to quickly grasp your company’s software architecture and processes.
In this way, software diagrams can even function as a codebase introduction for new employees.
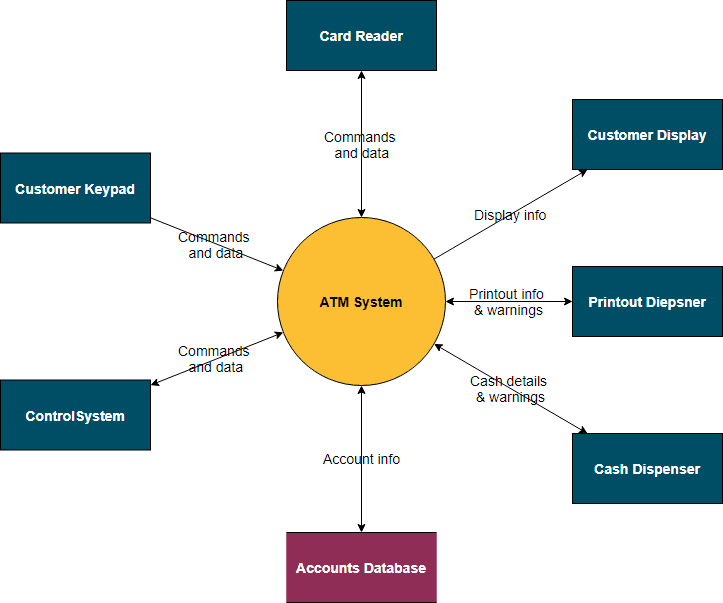
A particularly useful onboarding visual would be a context diagram. These diagrams display relationships between the main software and its accompanying components.
Here’s an example:
Source: Venngage
The arrows indicate the data flow between the main software and its various subsystems, providing a clear overview of the software’s architecture.
This type of high-level diagram is a great initiation for those users encountering the software for the first time.
Another massive benefit to diagrams is that they don’t take long to read yet convey plenty of information.
This is important, as research shows users don’t devote very much time to reading:

Source: Nielsen Norman Group / Image: Archbee.com
In other words, users typically default to skimming texts instead of reading from beginning to end. Luckily, diagrams are well-designed for this approach.
Since these visuals are so light on text, they’re ideally suited for scanning—something readers will enjoy, as it fits in with their typical behavioral patterns.
Consequently, not only do diagrams communicate well, they do so while complying with readers’ preferences.
All in all, diagrams bring countless benefits to software documentation and are essential for creating quality documents.
How to Design Diagrams for Software Documentation
There’s just one prerequisite for realizing the advantages that diagrams bring: the diagrams need to look good.
If your diagram is colorless, with heavy text and a complex flow, the visual will only harm your documentation’s quality.
After all, a diagram’s purpose is to convey information, which is challenging with a complex design. A simple yet informative layout is always best.
This topic was also discussed in a Reddit thread:

Source: Reddit
In other words, simplicity is vital. The more basic the diagram, the easier it will be to understand. The following sections will detail how to achieve this simple design.
Make Readability a Priority
Perhaps the most crucial aspect when designing diagrams is their readability. Quite simply, a diagram should be accessible and easy to read; the user shouldn’t struggle to understand it.
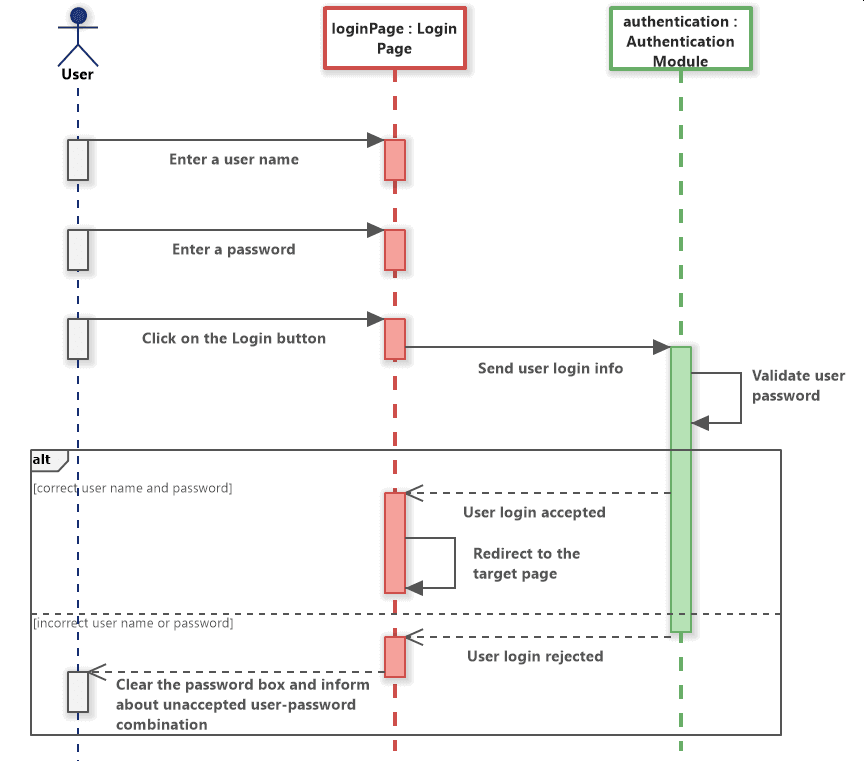
Consider the diagram below:
Source: Software Ideas Modeler
This diagram depicts a user’s login process and is notable for its perfect alignment. The three columns are equally spaced, and each action point box has the same width.
In addition, all boxes neatly end or begin with a connecting arrow, creating a cohesive feel.
The diagram also utilizes white space well. No two elements are placed too close together, so there’s no crowding between action points. Consequently, users can clearly read each portion.
Such attention to measurement, alignment and spacing contributes significantly to increasing readability and should be a design priority.
However, to further optimize your diagram’s readability, consider incorporating layers.
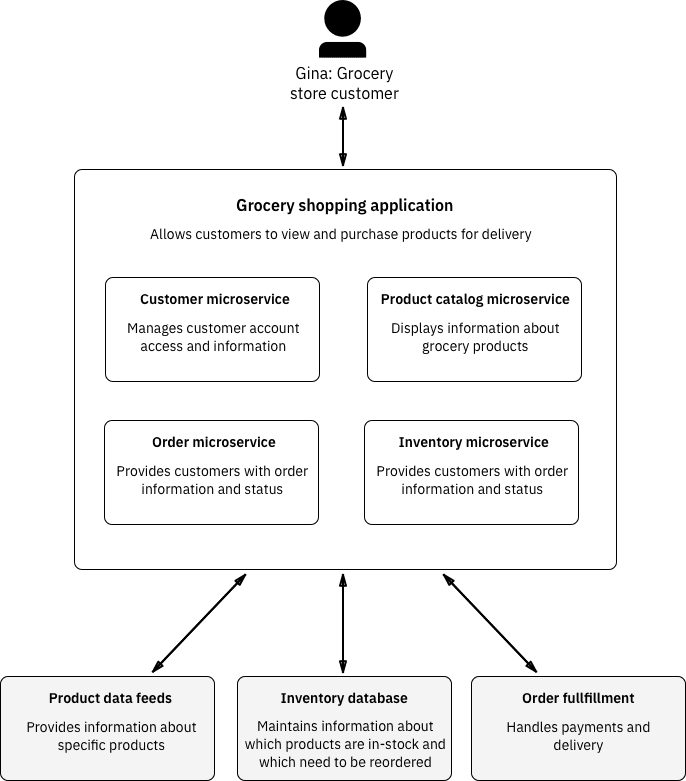
Look at this sample diagram:
Source: IBM
The diagram has three clear layers:
- the user view
- the microservices the user can use
- the systems and databases that power the microservices
Each level describes a specific functional space, and the diagram’s spacing clearly defines the boundaries between levels.
As such, readers should easily understand the basic architecture of this software.
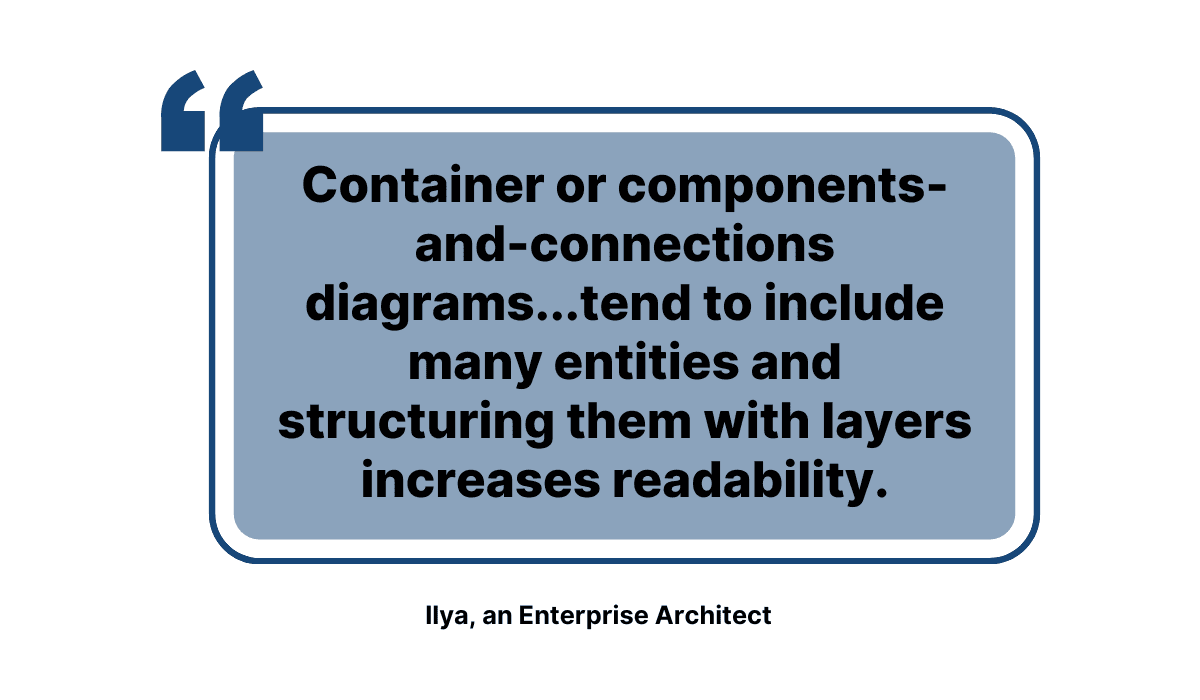
Ilya, an Enterprise Architect, specified when layers help the most:
Source: Vladimir Ivanov Dev Blog / Image: Archbee.com
If you’re designing container or components-and-connections diagrams, including layers is a great idea. Those elements are sure to increase readability.
Pay Attention to Typography
Although diagrams are primarily a visual element, there is also a textual component to them that shouldn’t be ignored.
Font, text size, and text color contribute to legibility, making typography essential in diagram design.
Regarding font, it’s best to consult your style guide (if applicable) or use a standard brand font.
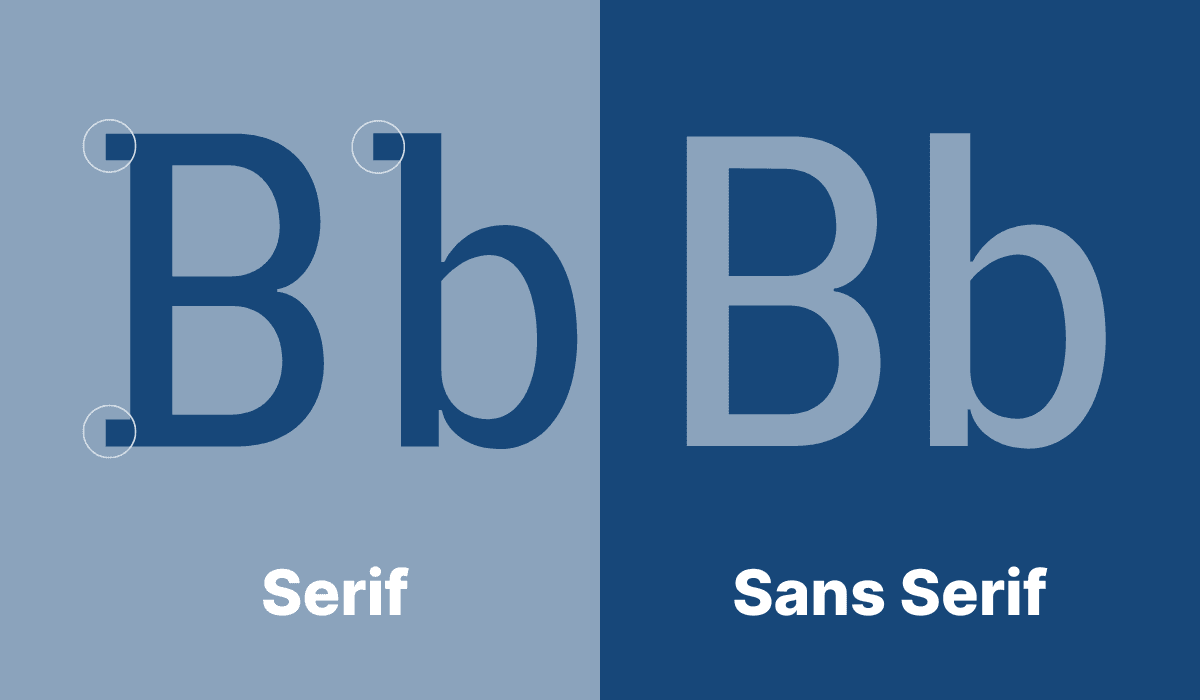
Lacking that option, you can choose between two types of font:
Source: Archbee.com
The serif font adds decorative lines or tapers to its letters, as depicted at the ends of the uppercase B and the top of the lowercase b.
These elements are missing in sans serif, where the lines are much cleaner.
Of the two, serif is more formal and the typical choice for software diagrams, given the professional setting.
However, if your company is relatively modern and has a playful tone, sans serif could be the better fit.
Whatever font you choose, just ensure the text is large enough to read easily. Furthermore, try utilizing bold, italic, and underline effects to emphasize specific terms.
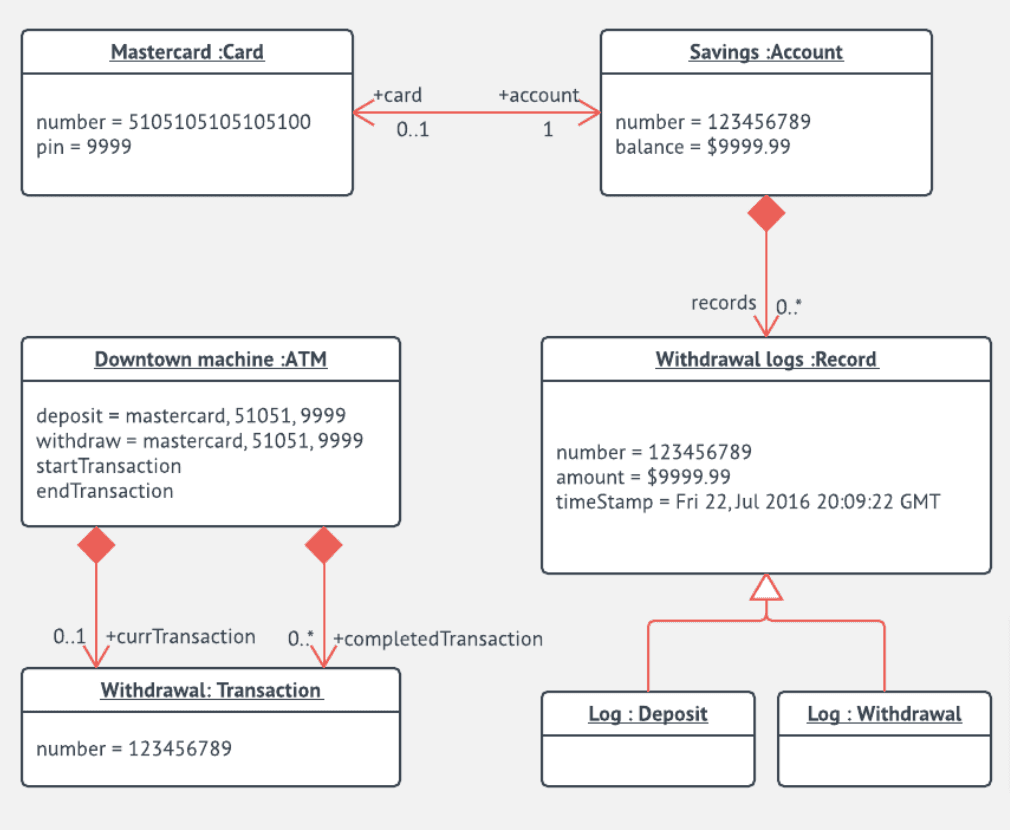
Here’s a good example:
Source: Lucidchart
This diagram utilizes bold and underlined text to name the main objects but then uses simple, unedited typography to provide more details.
The disparity between bold and simple text defines the information architecture, clearly marking what details are more important.
In this way, typography significantly contributes to the diagram’s clarity and effectiveness.
Choose a Good Color Scheme
Although perhaps not an obvious factor, color also makes a difference in software diagrams.
Would you rather disentangle a uniform diagram of white boxes or immediately differentiate variously-colored shapes?
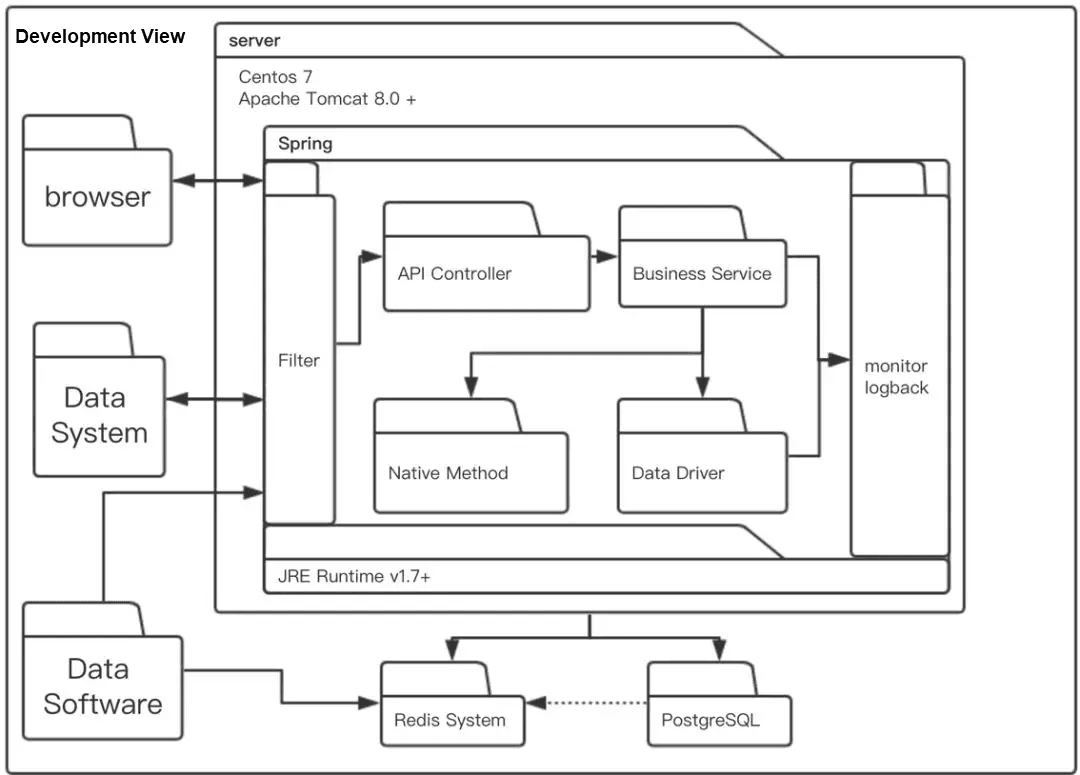
If you’re unsure, this example should help you decide:
Source: Alibaba Cloud
The diagram is difficult to decipher, as all its components are consistently white, regardless of their position and function.
Now imagine if the three outer files on the left were colored blue, the filter colored red, the inner folders green, etc.
The diagram would automatically gain legibility, as users would easily discern the different elements.
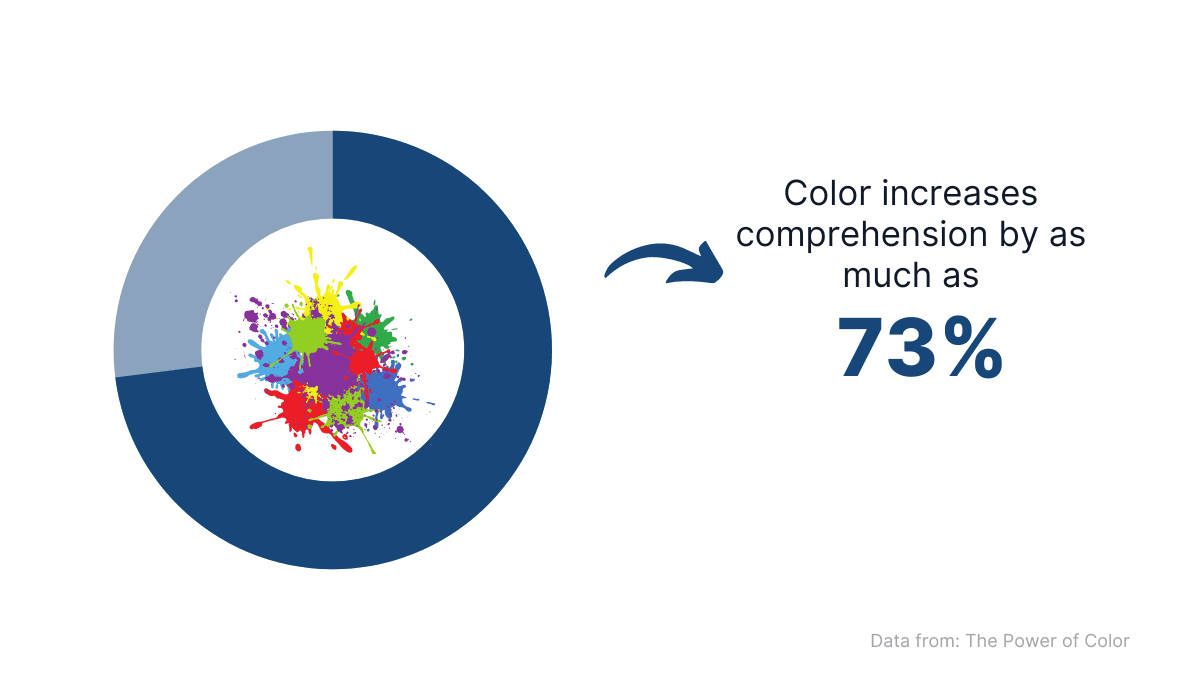
There have even been studies to prove color’s effectiveness:
Source: The Power of Color / Image: Archbee.com
Diagrams become much more engaging and accessible simply by adding color. Users will more easily understand the information the visual is trying to convey.
When choosing your color scheme, stick to your official company colors to maintain brand consistency.
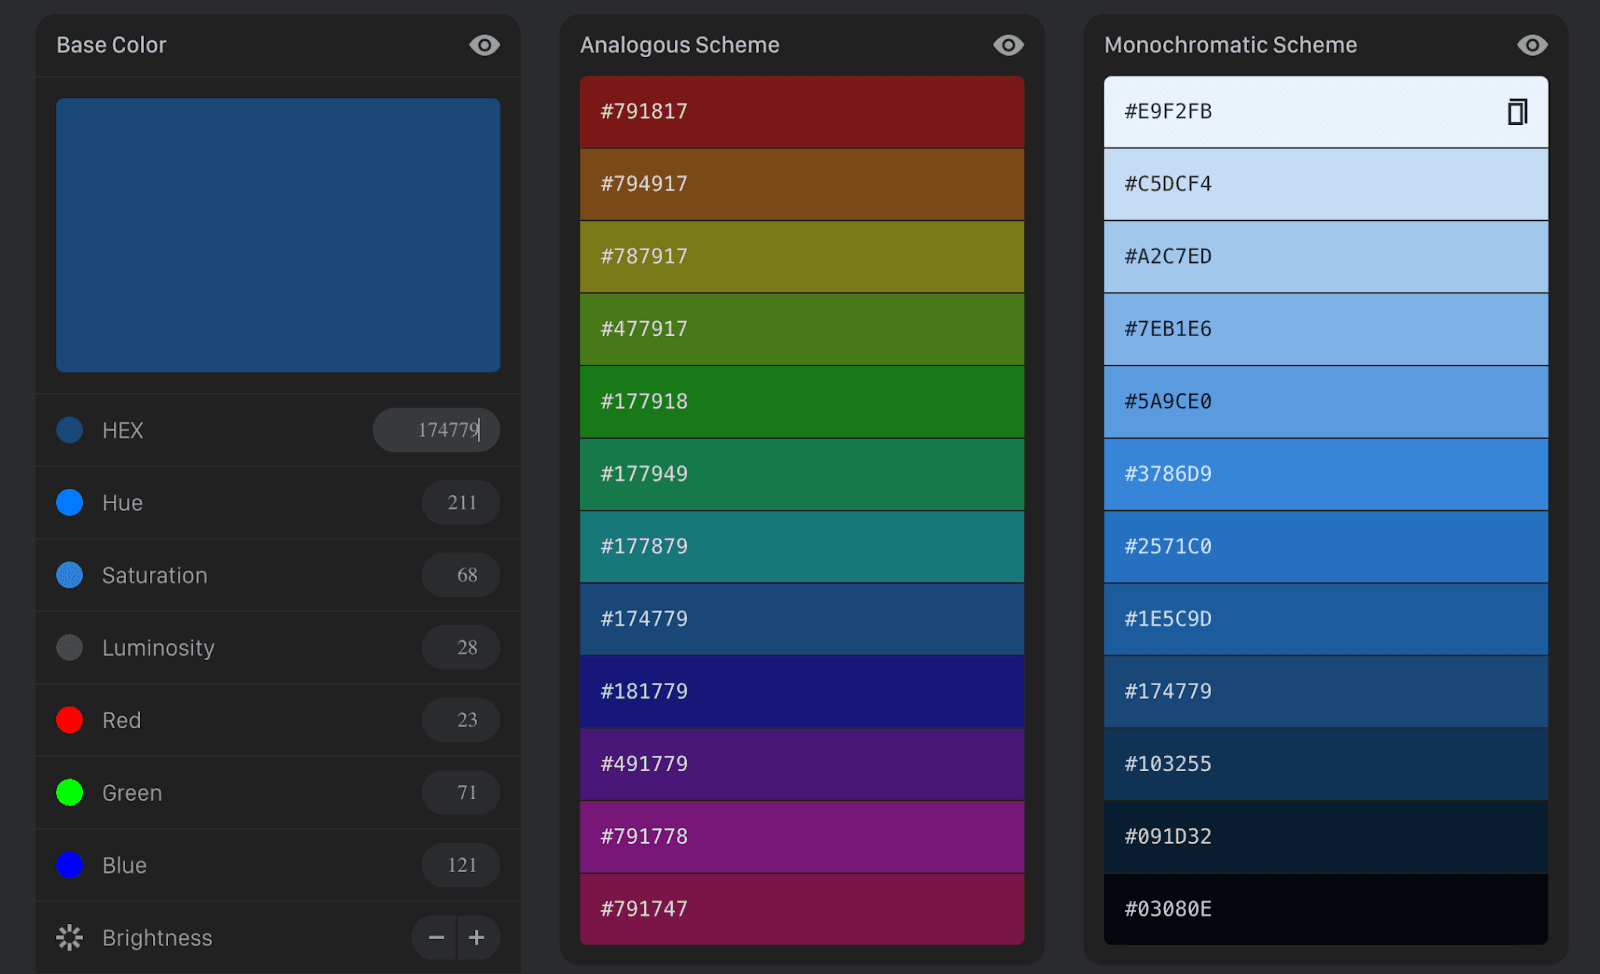
If your diagram requires more colors than your company uses for branding, try using the online Color Schemer tool.
This resource devises a color palette using your principal color as a base, creating a visually appealing arrangement.
Here’s the tool in action:
Source: Color Schemer
You can utilize the analogous or monochromatic scheme for a more varied or homogenous look respectively. Whatever option you choose, the colors will enrich your diagrams.
Tools to Create Diagrams for Software Documentation
When composing diagrams for software documentation, hand-drawn visuals aren’t really an option.
These documents should be high-quality records and their diagrams should live up to those standards.
In other words, you’ll need advanced tools to create accessible diagrams readers can easily understand. Luckily, there’s plenty available.
For example, Lucidchart is a web-based platform that allows users to draw diagrams and collaborate on them simultaneously.
You can view that here:

Source: Lucidchart
This feature significantly facilitates cooperation, as your employees can easily communicate while building diagrams.
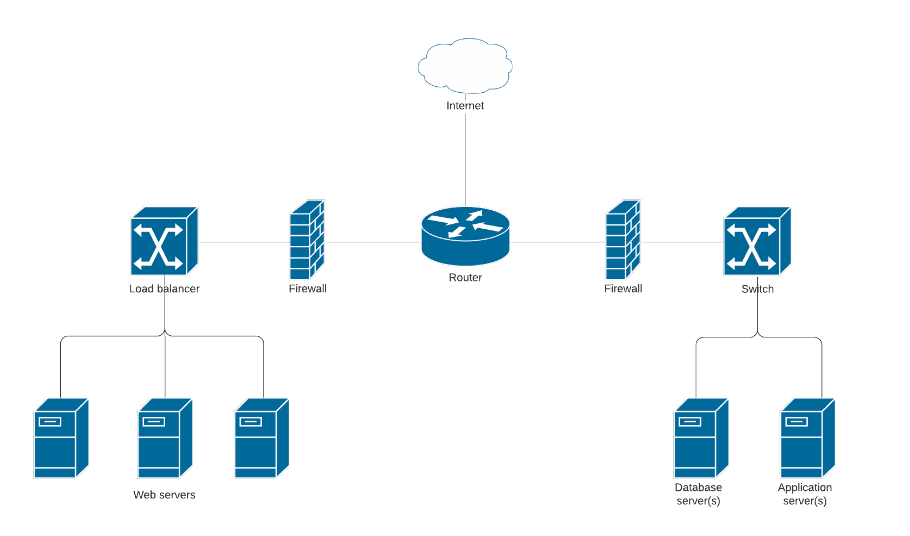
The cloud-based tool also offers several templates, so you’ll have a starting point when creating diagrams.
Here’s one example:
Source: Lucidchart
This preview is a web hosting architecture template, but there are hundreds of other pre-made options, so you’re bound to find one that suits your needs.
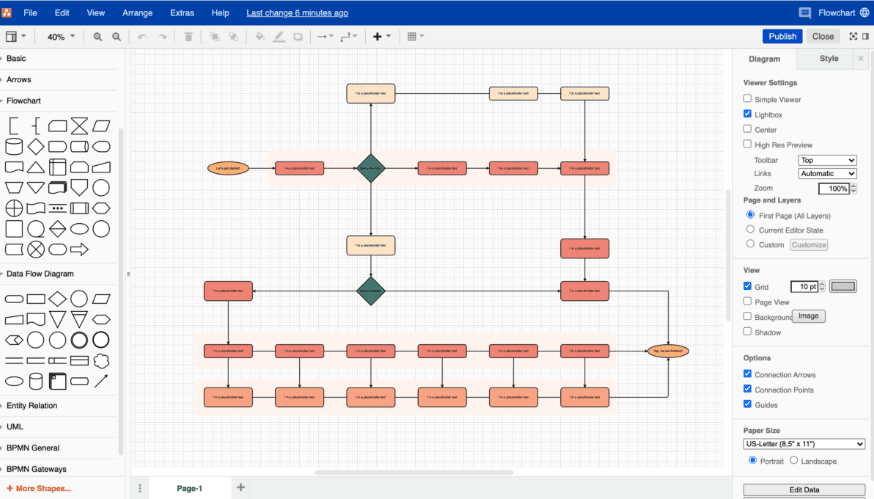
An alternative to Lucidchart is diagrams.net (draw.io). This browser-based, open-source tool doesn’t require user accounts and can be used anonymously, making it accessible to everyone.
The tool’s advantage is its simplicity—it features a drag-and-drop, WYSIWYG (what you see is what you get) interface. Take a look:
Source: Swimm
The available shapes and arrows are on the left-hand side, whereas the right-hand controls the customization options, making for a simple, intuitive diagram design.
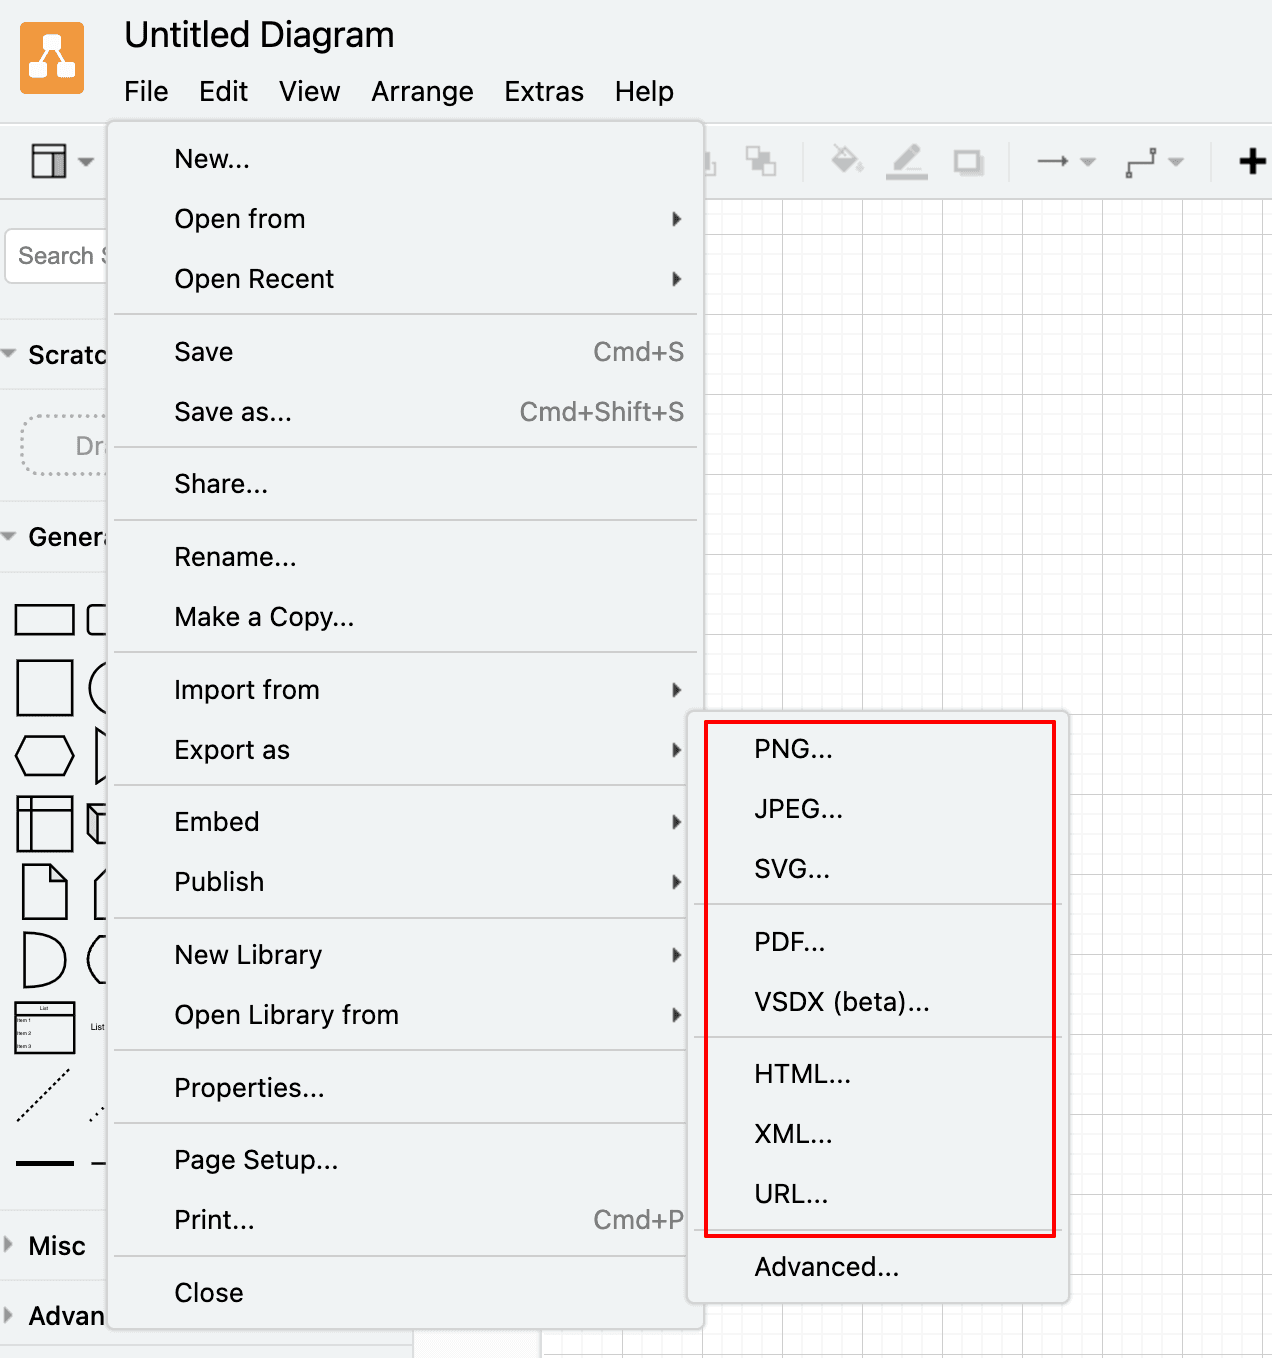
Once you’ve finished your diagram, the design can be exported as a PDF, SVG, HTML, and more.
The screenshot below shows all the options:
Source: diagrams.net
With this tool, you can easily create beautiful diagrams and download them in whatever format suits you, for seamless integration into your working software documentation.
However, if you’re not a fan of WYSIWYG, Mermaid might be a good option. This tool is a JavaScript-based solution that renders Markdown-inspired code into diagrams.
Instead of dragging shapes, code is automatically converted into a visual.
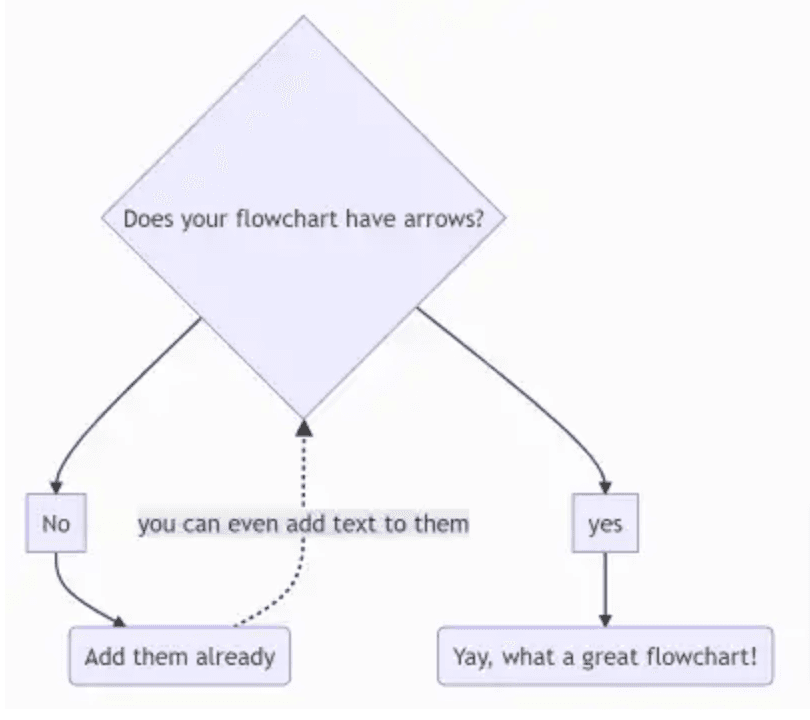
For example, consider this code snippet:

Source: Medium
Mermaid translates that text into the following diagram:
Source: Medium
The Markdown-like text regulates the diagram design, making it very adaptable. If you want to amend your design, simply edit the code, and the visual changes automatically.
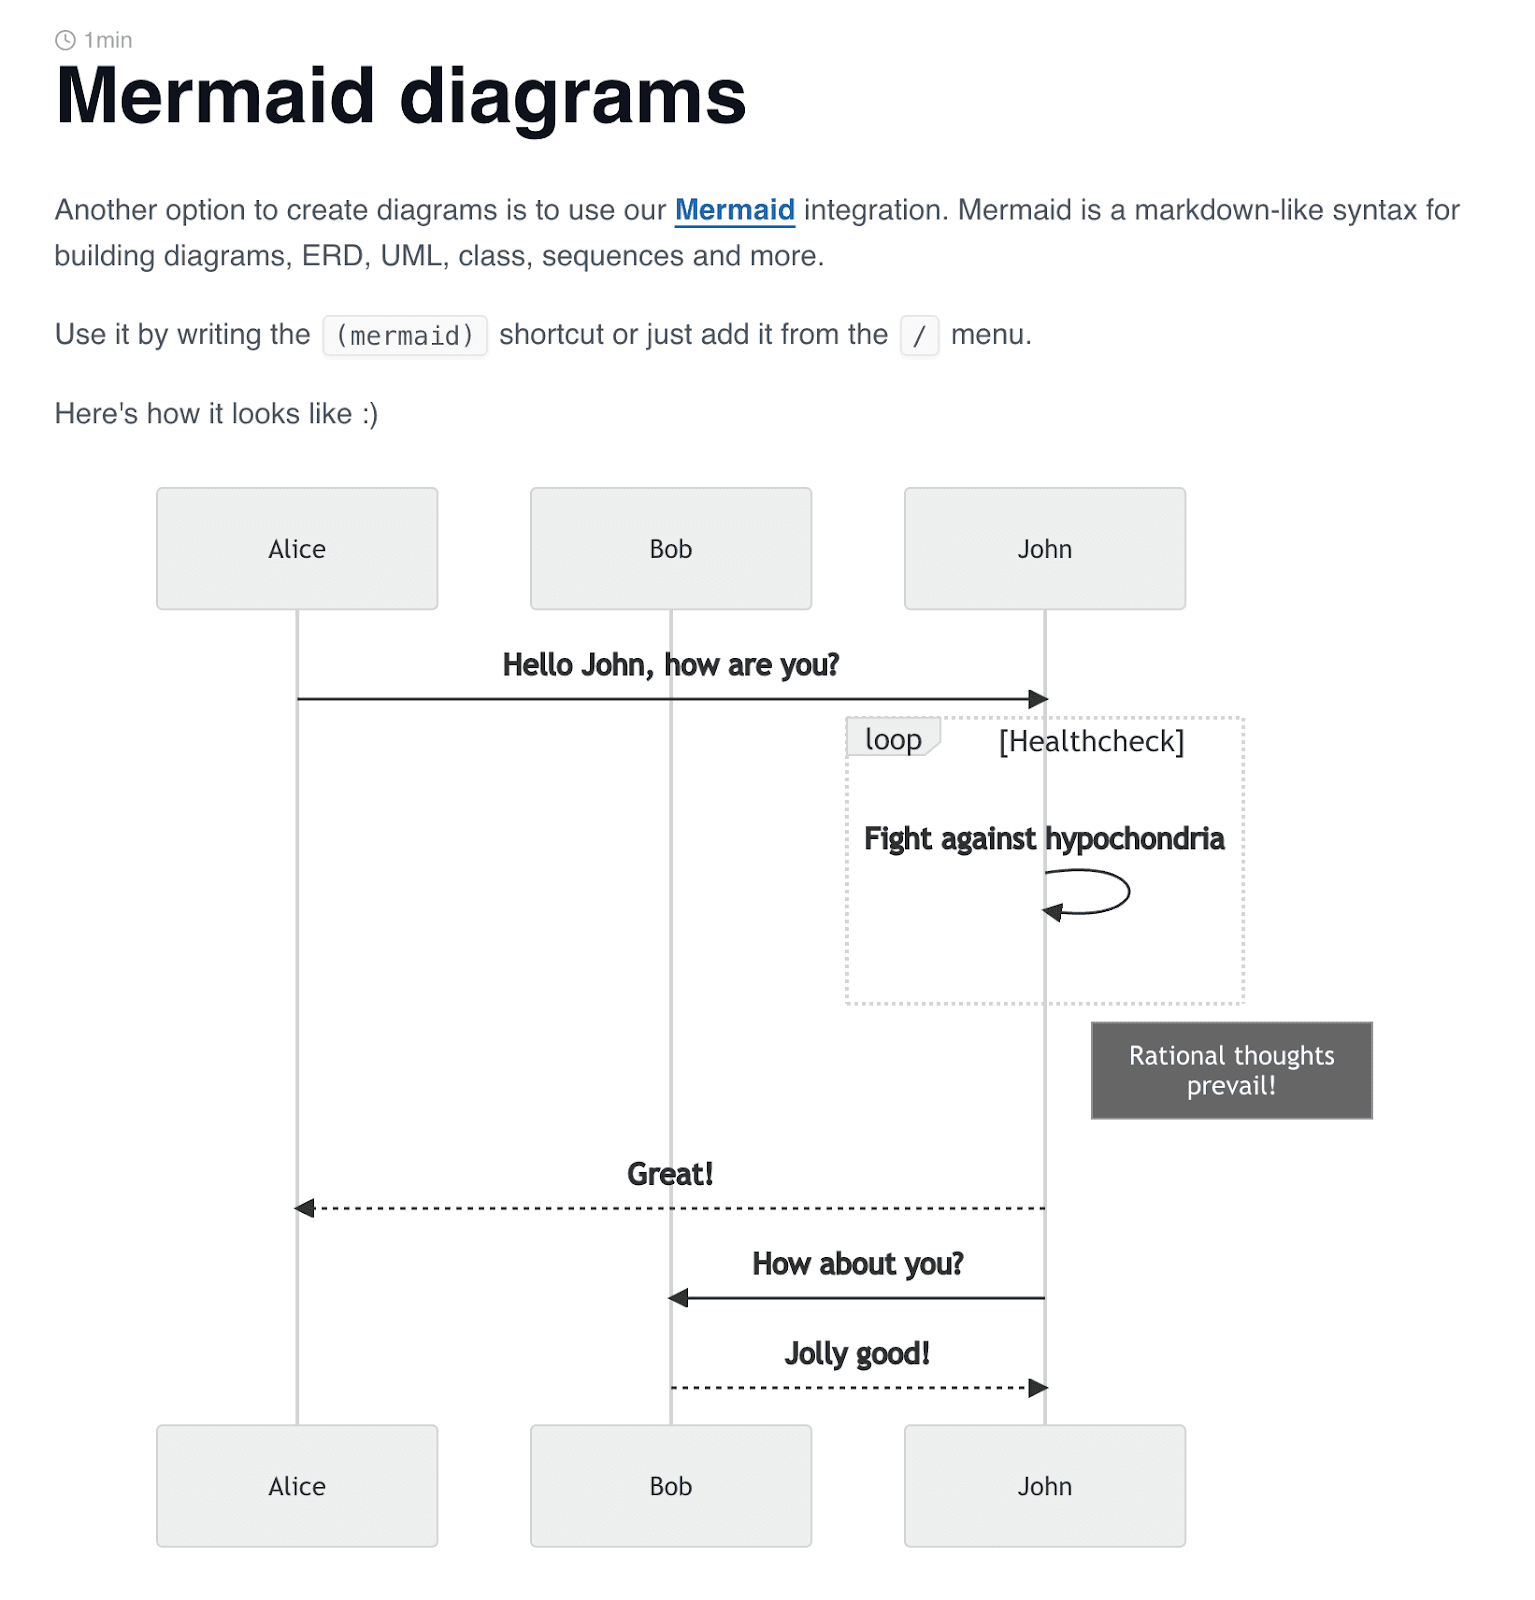
Mermaid also boasts several integrations, including with Archbee.
The diagram tool joined forces with our documentation platform to create maintainable, attractive visuals in the documentation itself.
Here’s a preview:
Source: docs.archbee.com
With this integration, you’ll be able to design diagrams directly in your documents without any copy-and-pasting or uploading.
Instead, all actions are executed in the same solution—combining two tools in one.
Conclusion
Diagrams are an invaluable part of software documentation. These tools render complex, multi-layered concepts into easily-digestible, intuitive visuals.
Consequently, users have an easier time understanding the document’s content.
When designing diagrams, it’s essential to make readability a priority, in part by paying attention to typography. Don’t forget to choose a good color scheme, either.
There are also several tools that can assist you (e.g., Lucidchart, diagrams.net, and Mermaid) so as to ensure high-quality design.
Take a look through your current documentation, and consider if there are any sections a diagram would improve—your users will surely appreciate it.
Mermaid also boasts several
FAQ
Frequently Asked Questions
Diagrams turn complex systems into clear, at-a-glance visuals. They show architectures, data flows, and dependencies in a way that’s faster to process than text alone, helping readers grasp concepts, relationships, and scope quickly. This supports how people actually read (they skim), shortens time-to-understanding, and makes onboarding smoother. Common uses include architecture overviews, logic or workflow diagrams, and context diagrams that show how your software interacts with surrounding systems.

